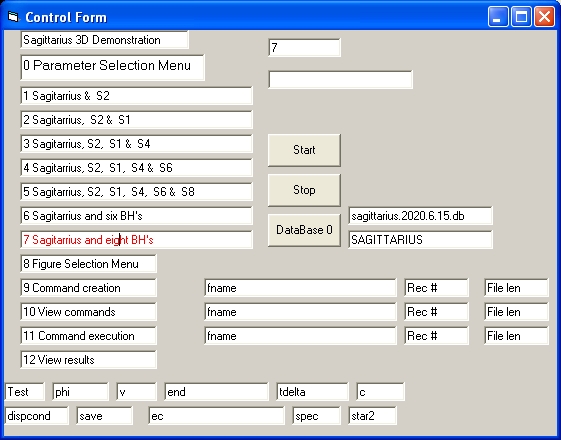
- The Control Form is used to select a planet simulation and to perform a simulation.
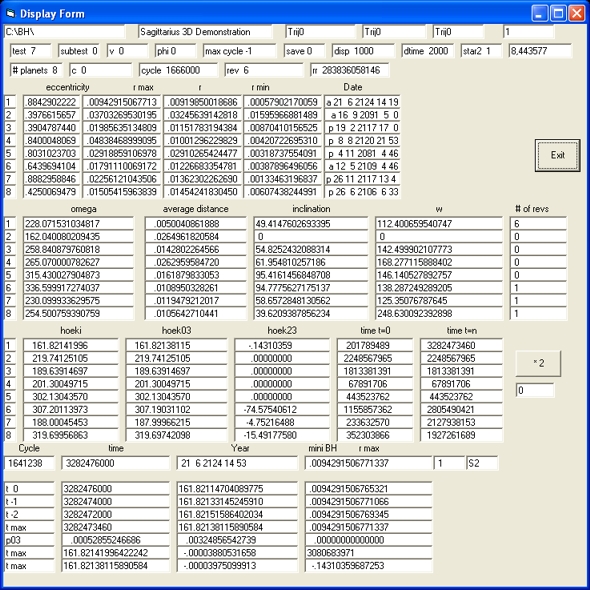
- The Display Form shows the results of a simultion and the result of a simulation saved in a Data Bae
- The Menu Form is to select additional parameters used by a planet simulation
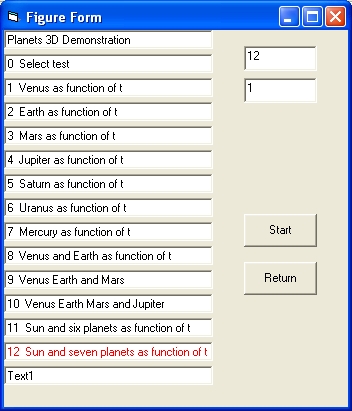
- The Figure Form is to select a simulation saved in a Data Base
Control Form - Operation
|
The control form is used to select and perform a simulation.
Those saved simulations are called figures or subtests.
|
Display Form - Operation
|
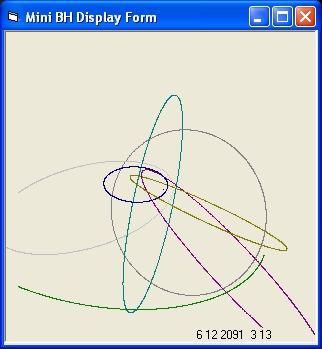
The Display Form is divided in 5 parts
|
|
Menu Form - Operation
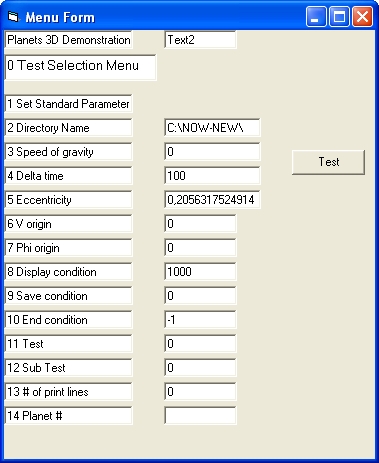
|
Figure Form - Operation
VB Sagittarius Software Description
-
Source and destination
The program supports 1 BH in the center and 8 sun's or mini BH's. Together 9 objects.
The names of the of the objects are stored in the array BHname0$(0-8)
This array stores the names in a standard order from low (S1) to high (S62)
The numbers of BH's are stored in the array source(0-8). The standard order of these numbers are from 0 to 8.
-
How to draw a mini BH in a picture
The size of Picture 1 in Form BH is 313 By 313 FormBH_Load xmaxBH 313.3333 ymaxBH 313.3333 x0dispBH 156.6667 y0dispBH 156.6667 FormBH_Load FormBH.Width 6795 FormBH.Height 5250 FormBH.Scalemode 3 GETSCREEN xmaxBH 313.3333 ymaxBH 313.3333 GETSCREEN x0dispBH 156.6667 y0dispBH 156.6667 xmaxph = pc*0.03 xdsBH1 = x0dispBH + xdsBH * scalexBH xdsBH1 = x0dispBH + (x0(i) - x0(0)) * scalexBH scalexBH = 0.8 * xmaxBH * mul1x / (0.03 * pc) xdsBH1 = x0dispBH + (x0(i) - x0(0)) * 0.8 * xmaxBH * mul1x / (0.03 * pc)id1 a e i (°) omega w (°) Tp (yr) P (yr) Kmag q (AU) v (%c) dv m0 S1 0.5950 0.5560 119.14 342.04 122.30 2001,800 166.0 14.70 2160.7 0.55 0.03 12.40 S2 0.1251 0.8843 133.91 228.07 66.25 2018,379 16.1 13.95 118.4 2.56 0.00 13.6 S4 0.3570 0.3905 80.33 258.84 290.80 1957,400 77.0 14.40 1779.7 0.57 0.01 12.2 S6 0.6574 0.8400 87.24 85.07 116.23 2108,610 192.0 15.40 860.3 0.94 0.00 9.2 S8 0.4047 0.8031 74.37 315.43 346.70 1983,640 92.9 14.50 651.7 1.07 0.0 13.2 S9 0.2724 0.6440 82.41 156.60 150.60 1976,710 51.3 15.10 793.2 0.93 0.02 8.2 S12 0.2987 0.8883 33.56 230.10 317.90 1995,590 58.9 15.50 272.9 1.69 0.01 7.6 S13 0.2641 0.4250 24.70 74.50 245.20 2004,860 49.0 15.80 1242.0 0.69 0.01 1. S14 0.2863 0.9761 100.59 226.38 334.59 2000,120 55.3 15.70 56.0 3.83 0.06 1 S62 0.0905 0.9760 72.76 122.61 42.62 2003,330 9.9 16.10 16.4 7.03 0.04 1 S66 1.5020 0.1280 128.50 92.30 134.00 1771,000 664.0 14.80 10712.4 0.21 0.02 1
Reflection 1
Reflection 2
Feedback
None
Created: 19 April 2020
Back to my home page: Contents of This Document
